Best Road Performance
gt
college basketball
cbbdata
Adjusted road performances in college basketball
The What
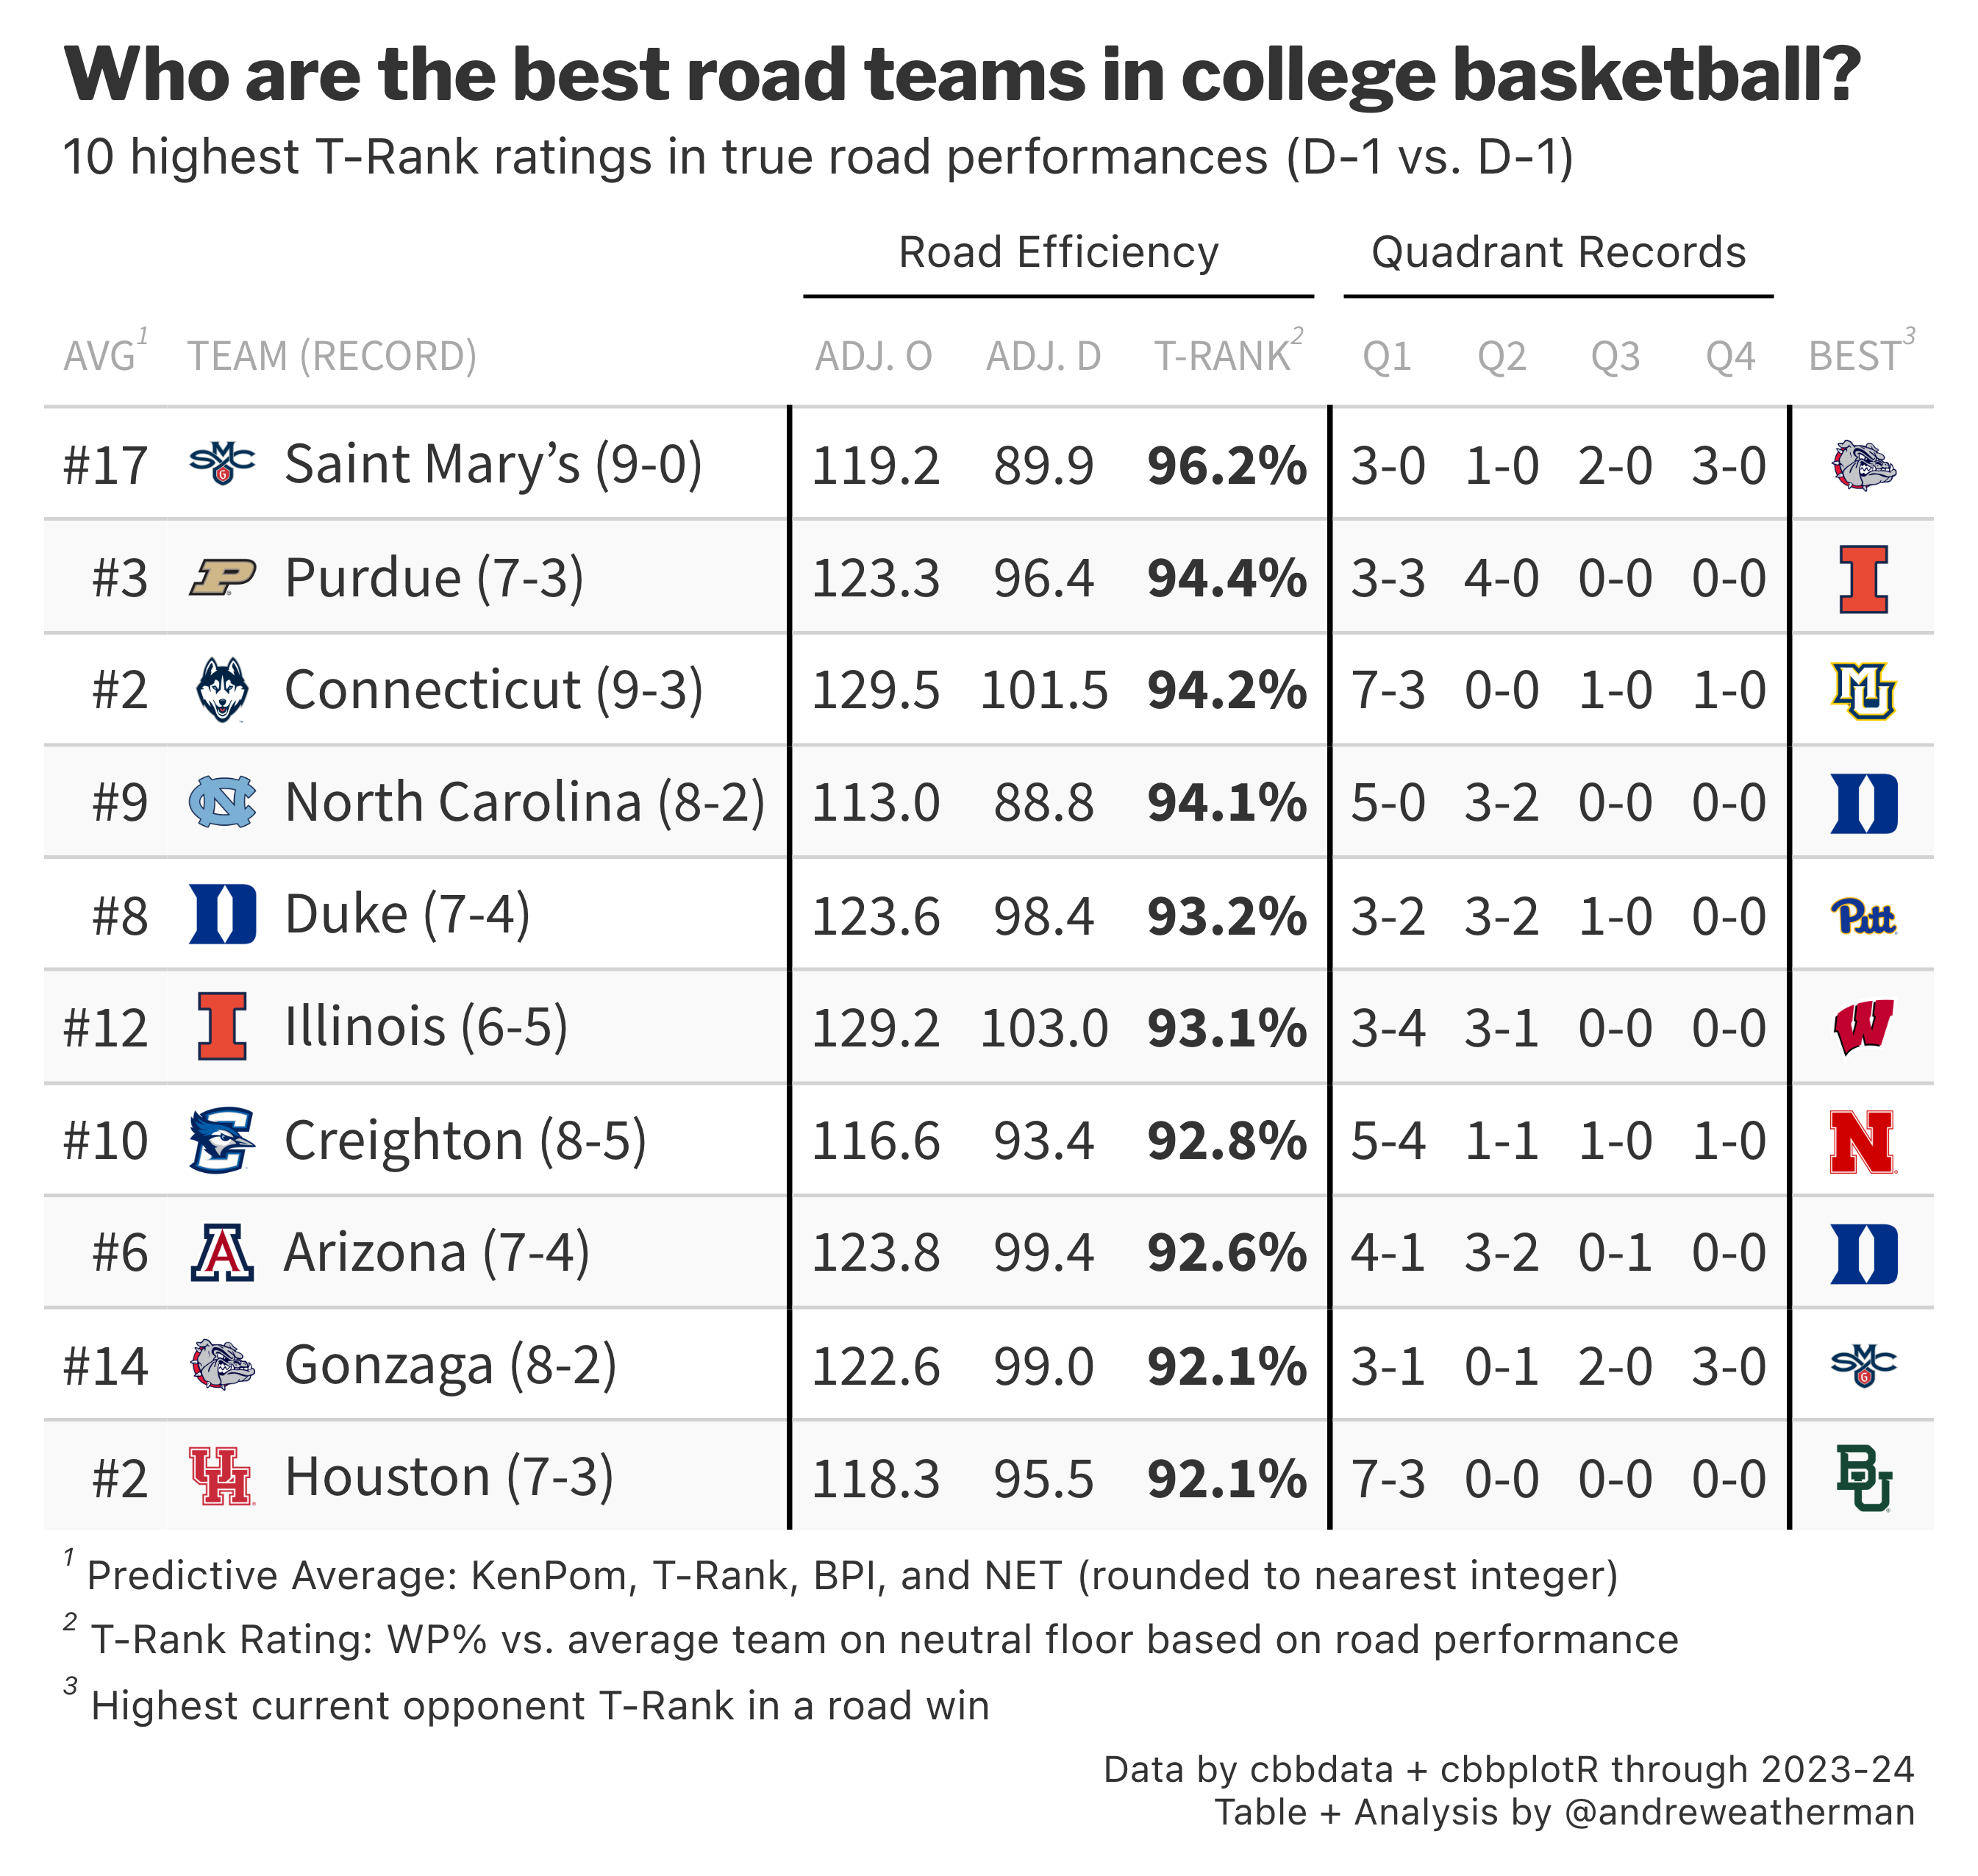
A gt table that calculates the 10 best T-Rank efficiency ratings in true D-1 vs. D-1 road performances – also includes a composite season-long predictive average across all games and quadrant records in true road games.
Final Table
The How
For this visualization, you will need the following packages:
Scripts
This visualization is not yet accompanied by a tutorial.
The Data
## grab ratings in away games vs. top 150
away_ratings <- cbd_torvik_team_factors(year = 2024, venue = 'away')
## get best away win by highest T-Rank
best_win <- cbd_torvik_game_factors(year = 2024, location = 'A') %>%
filter(result == 'W') %>%
left_join(cbd_torvik_ratings(year=2024) %>% select(team, barthag), join_by('opp' == 'team')) %>%
left_join(cbd_teams() %>% select(opp = common_team, opp_logo = logo)) %>%
slice_max(barthag, n = 1, by = team) %>%
select(team, opp_logo)
## get quad records in away games
quad_records <- cbd_torvik_team_schedule(year = 2024, location = 'A') %>%
filter(date < Sys.Date()) %>%
cbd_add_net_quad() %>%
# join on results
left_join(cbd_torvik_game_box(year = 2024) %>% select(date, team, opp, result),
by = c('date', 'team', 'opp')) %>%
summarize(
record = paste0(sum(result == 'W'), '-', sum(result == 'L')),
.by = c(team, quad)
) %>%
# pivot wider so we get proper joining + plotting format
pivot_wider(names_from = quad, values_from = record) %>%
# replace NAs (quads with no games) as 0-0
mutate(across(-team, ~ifelse(.x == 'NA-NA' | is.na(.x), '0-0', .x))) %>%
# rename // could do this later in gt
select(team, q1 = `Quadrant 1`, q2 = `Quadrant 2`, q3 = `Quadrant 3`, q4 = `Quadrant 4`)
# get predictive metric average
pred_avg <- cbd_all_metrics() %>%
summarize(
avg = (trank_rank + kp_rank + bpi_rank + net_rank) / 4,
.by = team
)
## join together
data <- list(away_ratings, quad_records, best_win, pred_avg) %>%
# use reduce to quickly join multiple DFs (passed as list) w/ a common key (team)
reduce(left_join, by = 'team') %>%
# take highest barthags
slice_max(barthag, n = 10) %>%
# add logos
left_join(cbd_teams() %>% select(team = common_team, logo = logo)) %>%
mutate(team = glue("<img src='{logo}' style='height: 20px; width: auto; vertical-align: -25%;'> {team}")) %>%
# add record column // add record to logo col.
mutate(record = paste0(wins, '-', losses),
team = paste0(team, ' (', record, ')'),
avg = paste0('#', round(avg, 0))) %>%
# select columns to plot
select(avg, team, adj_o, adj_d, barthag, starts_with('q'), best = opp_logo)The Table
# make table
data %>%
# set table id so we can use css later
gt(id = 'table') %>%
# add theme as a base
gt_theme_nytimes() %>%
# render logos
fmt_markdown(team) %>%
# render best win logo
fmt_image(best, width = 20, height = 20) %>%
# round numbers
fmt_number(columns = adj_o:adj_d, decimals = 1) %>%
fmt_percent(columns = barthag, decimals = 1) %>%
# align cols
cols_align(columns = avg, 'right') %>%
cols_align(columns = -c(team, avg), 'center') %>%
# bold barthag
tab_style(locations = cells_body(columns = barthag), style = cell_text(weight = 'bold')) %>%
# add spanner for quad
tab_spanner(columns = q1:q4, label = 'Quadrant Records') %>%
# add spanner for t-rank
tab_spanner(columns = adj_o:barthag, label = 'Road Efficiency') %>%
# add dividers
gt_add_divider(team, include_labels = FALSE, color = 'black', weight = px(1.5)) %>%
gt_add_divider(barthag, include_labels = FALSE, color = 'black', weight = px(1.5)) %>%
gt_add_divider(q4, include_labels = FALSE, color = 'black', weight = px(1.5)) %>%
# add footnote for best win
tab_footnote(locations = cells_column_labels(columns = best),
footnote = 'Highest current opponent T-Rank in a road win') %>%
# add footnote for T-Rank
tab_footnote(locations = cells_column_labels(columns = barthag),
footnote = 'T-Rank Rating: WP% vs. average team on neutral floor based on road performance') %>%
# add footnote for pred average
tab_footnote(locations = cells_column_labels(columns = avg),
footnote = 'Predictive Average: KenPom, T-Rank, BPI, and NET (rounded to nearest integer)') %>%
# rename cols.
cols_label(
team = 'Team (record)',
adj_o = 'Adj. O',
adj_d = 'Adj. D',
barthag = 'T-Rank',
best = 'Best'
) %>%
# add stripping b/c why not and it looks good
opt_row_striping() %>%
tab_options(data_row.padding = 4,
footnotes.font.size = 11,
# do this so we have the light lines below column spanners!
column_labels.border.bottom.style = "solid",
column_labels.border.bottom.width = px(1),
column_labels.border.bottom.color = "black",
table.border.bottom.style = 'none',
source_notes.font.size = 10,
source_notes.border.lr.style = "none") %>%
# add headers // labs
tab_header(
title = 'Who are the best road teams in college basketball?',
subtitle = "10 highest T-Rank ratings in true road performances (D-1 vs. D-1)"
) %>%
tab_source_note(
md("Data by cbbdata + cbbplotR through 2023-24<br>Table + Analysis by @andreweatherman")
) %>%
# css // this does some light other formatting and styling
opt_css(
'#table .gt_footnote {
padding-top: 2px !important;
padding-bottom: 2px !important;
line-height: 1;
}
#table .gt_heading {
padding-bottom: 0px;
padding-top: 6px
}
#table .gt_subtitle {
padding-top: 2px;
padding-bottom: 6px;
}
#table .gt_sourcenote {
text-align: right
}
'
) %>%
# save it!
gtsave_extra('best_road_teams.png', zoom = 3)Complete Script
library(cbbdata)
library(cbbplotR)
library(tidyverse)
library(gt)
library(gtExtras)
away_ratings <- cbd_torvik_team_factors(year = 2024, venue = 'away')
best_win <- cbd_torvik_game_factors(year = 2024, location = 'A') %>%
filter(result == 'W') %>%
left_join(cbd_torvik_ratings(year=2024) %>% select(team, barthag), join_by('opp' == 'team')) %>%
left_join(cbd_teams() %>% select(opp = common_team, opp_logo = logo)) %>%
slice_max(barthag, n = 1, by = team) %>%
select(team, opp_logo)
quad_records <- cbd_torvik_team_schedule(year = 2024, location = 'A') %>%
filter(date < Sys.Date()) %>%
cbd_add_net_quad() %>%
left_join(cbd_torvik_game_box(year = 2024) %>% select(date, team, opp, result),
by = c('date', 'team', 'opp')) %>%
summarize(
record = paste0(sum(result == 'W'), '-', sum(result == 'L')),
.by = c(team, quad)
) %>%
pivot_wider(names_from = quad, values_from = record) %>%
mutate(across(-team, ~ifelse(.x == 'NA-NA' | is.na(.x), '0-0', .x))) %>%
select(team, q1 = `Quadrant 1`, q2 = `Quadrant 2`, q3 = `Quadrant 3`, q4 = `Quadrant 4`)
pred_avg <- cbd_all_metrics() %>%
summarize(
avg = (trank_rank + kp_rank + bpi_rank + net_rank) / 4,
.by = team
)
data <- list(away_ratings, quad_records, best_win, pred_avg) %>%
reduce(left_join, by = 'team') %>%
slice_max(barthag, n = 10) %>%
left_join(cbd_teams() %>% select(team = common_team, logo = logo)) %>%
mutate(team = glue("<img src='{logo}' style='height: 20px; width: auto; vertical-align: -25%;'> {team}")) %>%
mutate(record = paste0(wins, '-', losses),
team = paste0(team, ' (', record, ')'),
avg = paste0('#', round(avg, 0))) %>%
select(avg, team, adj_o, adj_d, barthag, starts_with('q'), best = opp_logo)
data %>%
gt(id = 'table') %>%
gt_theme_nytimes() %>%
fmt_markdown(team) %>%
fmt_image(best, width = 20, height = 20) %>%
fmt_number(columns = adj_o:adj_d, decimals = 1) %>%
fmt_percent(columns = barthag, decimals = 1) %>%
cols_align(columns = avg, 'right') %>%
cols_align(columns = -c(team, avg), 'center') %>%
tab_style(locations = cells_body(columns = barthag), style = cell_text(weight = 'bold')) %>%
tab_spanner(columns = q1:q4, label = 'Quadrant Records') %>%
tab_spanner(columns = adj_o:barthag, label = 'Road Efficiency') %>%
gt_add_divider(team, include_labels = FALSE, color = 'black', weight = px(1.5)) %>%
gt_add_divider(barthag, include_labels = FALSE, color = 'black', weight = px(1.5)) %>%
gt_add_divider(q4, include_labels = FALSE, color = 'black', weight = px(1.5)) %>%
tab_footnote(locations = cells_column_labels(columns = best),
footnote = 'Highest current opponent T-Rank in a road win') %>%
tab_footnote(locations = cells_column_labels(columns = barthag),
footnote = 'T-Rank Rating: WP% vs. average team on neutral floor based on road performance') %>%
tab_footnote(locations = cells_column_labels(columns = avg),
footnote = 'Predictive Average: KenPom, T-Rank, BPI, and NET (rounded to nearest integer)') %>%
cols_label(
team = 'Team (record)',
adj_o = 'Adj. O',
adj_d = 'Adj. D',
barthag = 'T-Rank',
best = 'Best'
) %>%
opt_row_striping() %>%
tab_options(data_row.padding = 4,
footnotes.font.size = 11,
column_labels.border.bottom.style = "solid",
column_labels.border.bottom.width = px(1),
column_labels.border.bottom.color = "black",
table.border.bottom.style = 'none',
source_notes.font.size = 10,
source_notes.border.lr.style = "none") %>%
tab_header(
title = 'Who are the best road teams in college basketball?',
subtitle = "10 highest T-Rank ratings in true road performances (D-1 vs. D-1)"
) %>%
tab_source_note(
md("Data by cbbdata + cbbplotR through 2023-24<br>Table + Analysis by @andreweatherman")
) %>%
opt_css(
'#table .gt_footnote {
padding-top: 2px !important;
padding-bottom: 2px !important;
line-height: 1;
}
#table .gt_heading {
padding-bottom: 0px;
padding-top: 6px
}
#table .gt_subtitle {
padding-top: 2px;
padding-bottom: 6px;
}
#table .gt_sourcenote {
text-align: right
}
'
) %>%
gtsave_extra('best_road_teams.png', zoom = 5)